

When it comes to running an online store, one of the most important things is knowing current trends. Things like what shoppers really look for and what marketing or other tactics competing sellers are implementing holds much importance in a long run.
That’s why understanding previous and current eCommerce statistics is important for growing your business online. But among all industries, eCommerce deals with the most overwhelming amount of statistical data.
Diving blindly on the internet will take you hours to get to the most important data. Not to mention, the outdated data that you may still think is new. In this guide, you’ll find eCommerce statistics that are recent and useful to grow the business of online store owners & retailers like you.
You’ll get a complete idea of how e-commerce is changing and how its future is predicted. These insights will be game-changing to make the correct moves for your online retail business.
Ecommerce Statistics: Key Findings
By end of the year 2022, the e-commerce industry is likely to generate 5.54 trillion dollars in sales, which itself is a great sign of eCommerce growth from last year. We have hand-picked the important stats that you as an online retail/e-commerce brand should know.
- As per Statista, online e-commerce retail sale was 4.9 Trillion USD in 2021, which is expected to grow by 50% in four years, reaching $7.4 Trillion.
- About 60% of internet users make an online purchase every week.
- Customers spend the most online purchases on electronics (988.4 billion dollars) and fashion items (904.5 billion dollars).
- Fashion shoppers visit 32 pages before making a purchase.
- China generates about $363.3 billion in revenue through social media e-commerce sales. That’s 10 times more than the United States.
- In 2021, mobile e-commerce sales reached $3.5 trillion which is about 22% more than the $2.9 trillion registered in the previous year.
- In the U.S., about 61% of people make online purchases based on blog recommendations.
- Over 59% of Millennials go to Amazon first to buy something online. This makes the online giant your biggest competing store.
- The eCommerce industry is growing 23% year-over-year…,
- Yet 46% of American small businesses still don’t have a website. This is a sign that growth is still possible. For more insights on small-time businesses, check out Small Business statistics.
- The average website conversion rate in America is only 2.63%. In comparison, the global website conversion rate is 4.31%
- Globally, about 57% of online shoppers purchase from overseas retailers.
Global E-commerce Sales Growth: Will E-commerce Overpower Retail?
The biggest improvement in e-commerce sales that we saw was between 2018 to 2020, when the revenue jumped from 2.98 billion dollars to 4.24 billion dollars. As we said, the expected growth in e-commerce sales is about $7.4 in 2025.
These numbers simply mean that customers prefer buying online. The more will be growth in e-commerce, the more it would seem to take over retail stores. But is it really the case?
Well, it’s not completely true. Although online shopping has affected retail stores badly, it’s more likely that e-commerce will merge with retail stores. It’s not like customers don’t like shopping in stores. They find online shopping more convenient and safe especially after Covid.

eCommerce Marketing Statistics: Personalized Ads, Trends & Branding
When it comes to e-commerce, marketing plays a very important role in the success of a business. Email marketing provides the highest ROI among all marketing campaigns but one must use it responsibly to benefit from it. The following marketing statistics will help you understand how marketing plays an important role in the growth of e-commerce.
- As per Shopify, 41% of brands will increase their paid and organic search budget in 2022.
- For 78% of marketers, brand purpose is more critical than ever after the pandemic in 2020.
- 61% of online shoppers prefer to be reached out to by brands via email.
- For each $1 spent on email marketing, you’ll get a return of $44.
- About 59% of brands agree that they have strategies for collecting first-party customer data.
- Among the top 1000 US online retailers, 58% of them send welcome emails to new customers.
- 85% of e-commerce businesses say that they provide a personalized experience to their customers, but only 60% of shoppers agree that they receive it.
- Nonprofits tend to miss out on donations of about $15k per year due to spam filters blocking their fund-raiser emails.
- Email marketing brings an average of 20% traffic to increase e-commerce sales.
- 60% of online shoppers agree that they purchased because of an email marketing message they got.
Brands are focusing more and more on customer experience as 62% of online shoppers agree that customer service has a significant influence on their purchase decisions. This improves their loyalty to the brand. Customer Loyalty statistics will give you better insights.
E-commerce Social Media Statistics: Use of Social Media By Online Buyers & Sellers
Anyone who’s planning to run a successful e-commerce store should be well aware of the benefits that social media has to offer. A good social presence is bound to show significant growth in profits and sales. Like it or not, if you want to reach greater success with your e-commerce website or any sort of online business, social media deserves your special attention. To prove this point, see the social media statistical facts below.

- About 4.62 billion people in the world use social media, which is more than half of the total population.
- The most used social media platforms are Facebook (2.9 B users), YouTube (2.5 B), Whatsapp (2 B), and Instagram (1.5 B).
- Brands spent around $154 billion on social media ads in 2021.
- About 25% of online customers in the US use social media platforms to consult about gifts for family & friends.
- On average, online stores that have a social media presence win 32% more sales than those that don’t.
- A whopping 74% of shoppers use social media platforms to make purchase decisions.
- As per Shopify, of all social media sites, 85% of orders come from Facebook.
- After looking at an Instagram ad., about 75% of users take an action, such as visiting a website, checking out products, or buying something.
- The average amount that online shoppers spend on Instagram orders is $65, and on Facebook ($55), Twitter (46%), and YouTube ($38).
- A social media post with a caption of 80 characters or less creates 66% more engagement than others.
- Posting on social platforms 3-4 times a week creates 71% more engagement. improves Brand awareness.
All in all, posting on social media makes people aware of your brand and creates better engagement. Here’s how to increase brand awareness through social media.
eCommerce Mobile Statistics: How People Shop with Mobile Devices?
Mobile shopping has always been popular and it keeps growing. Here is an interesting fact; back in 2016, 52.5% of total eCommerce sales were generated from mobile purchases, which is increased to 72.9% currently in 2022. A total of 39.1% increase in the share of mobile e-commerce sales.
This shows the necessity of mobile optimization for a successful eCommerce website. To understand why mobile e-commerce is so popular, here’s a list of some important mobile eCommerce statistics.
- Shopping apps are more popular among IOS users compared to Android users.
- Over half of online shoppers use smartphones for shopping.
- With more than 203 million downloads worldwide, Shoppe was the most downloaded mobile shopping app in 2021.
- During the holiday season, 40% of all online purchases are made using smartphones.
- During Black Friday and Cyber Monday of 2018, mobile eCommerce sales were over $2 billion which broke all previous records.
- According to Google, the bounce rate of mobile sites increases by 32% if the page loading speed increases from 1 second to 3 seconds.
- A shopper’s friend has more influence on mobile purchase decisions compared to email marketing, and online or Facebook ads.
Price Comparison on Smartphones
- 65% of customers compare online prices on mobile while in a physical store, and 32% of them change their minds about purchasing from the store.
- 93% of Millennials compare online deals on smartphones before making a purchase.
- Google says that if users have a negative experience while using mobile websites, they are 62% less likely to come back again in the future.
- Mobile apps have 3 times higher conversion rate than mobile websites
- Having a Call to Action button on your mobile app will result in a 45% increase in clicks.
- 73% of online shoppers switch from slow & poorly optimized mobile websites to ones that facilitate easy purchases.
Online Shopping Cart Statistics: Customer Behaviour While Checking Out
Believe it or not, how your shopping cart & checkout work can have a huge impact on your sales. It’s the last step of where purchases are completed. There are many revelations about shopping cart eCommerce statistics and one thing is for sure – Your cart abandonment rate will impact sales very badly.
Shopper’s Behaviour While Purchasing Online:

- When it comes to paying for online purchases, digital/mobile wallets are the most preferred with 49% of transactions worldwide, followed by
- Credit cards (21%)
- Debit cards (13%)
- Bank transfers (7%)
- BNPL (3%)
- Cash on delivery (3%)
- About 46% of small to medium size businesses say that profit increases when they offer free shipping.
- If your website doesn’t offer guest check-out and requires account creation to complete purchases, 23% of buyers will abandon their cart immediately.
- Exit-intent popups (confirmation popup that appears on the screen when a user is about to leave your website) helps to recover 53% of customers who tries to leave your website.
- An optimized checkout design of your e-commerce site can increase the chances of purchase completion (conversion rate) by 35%.
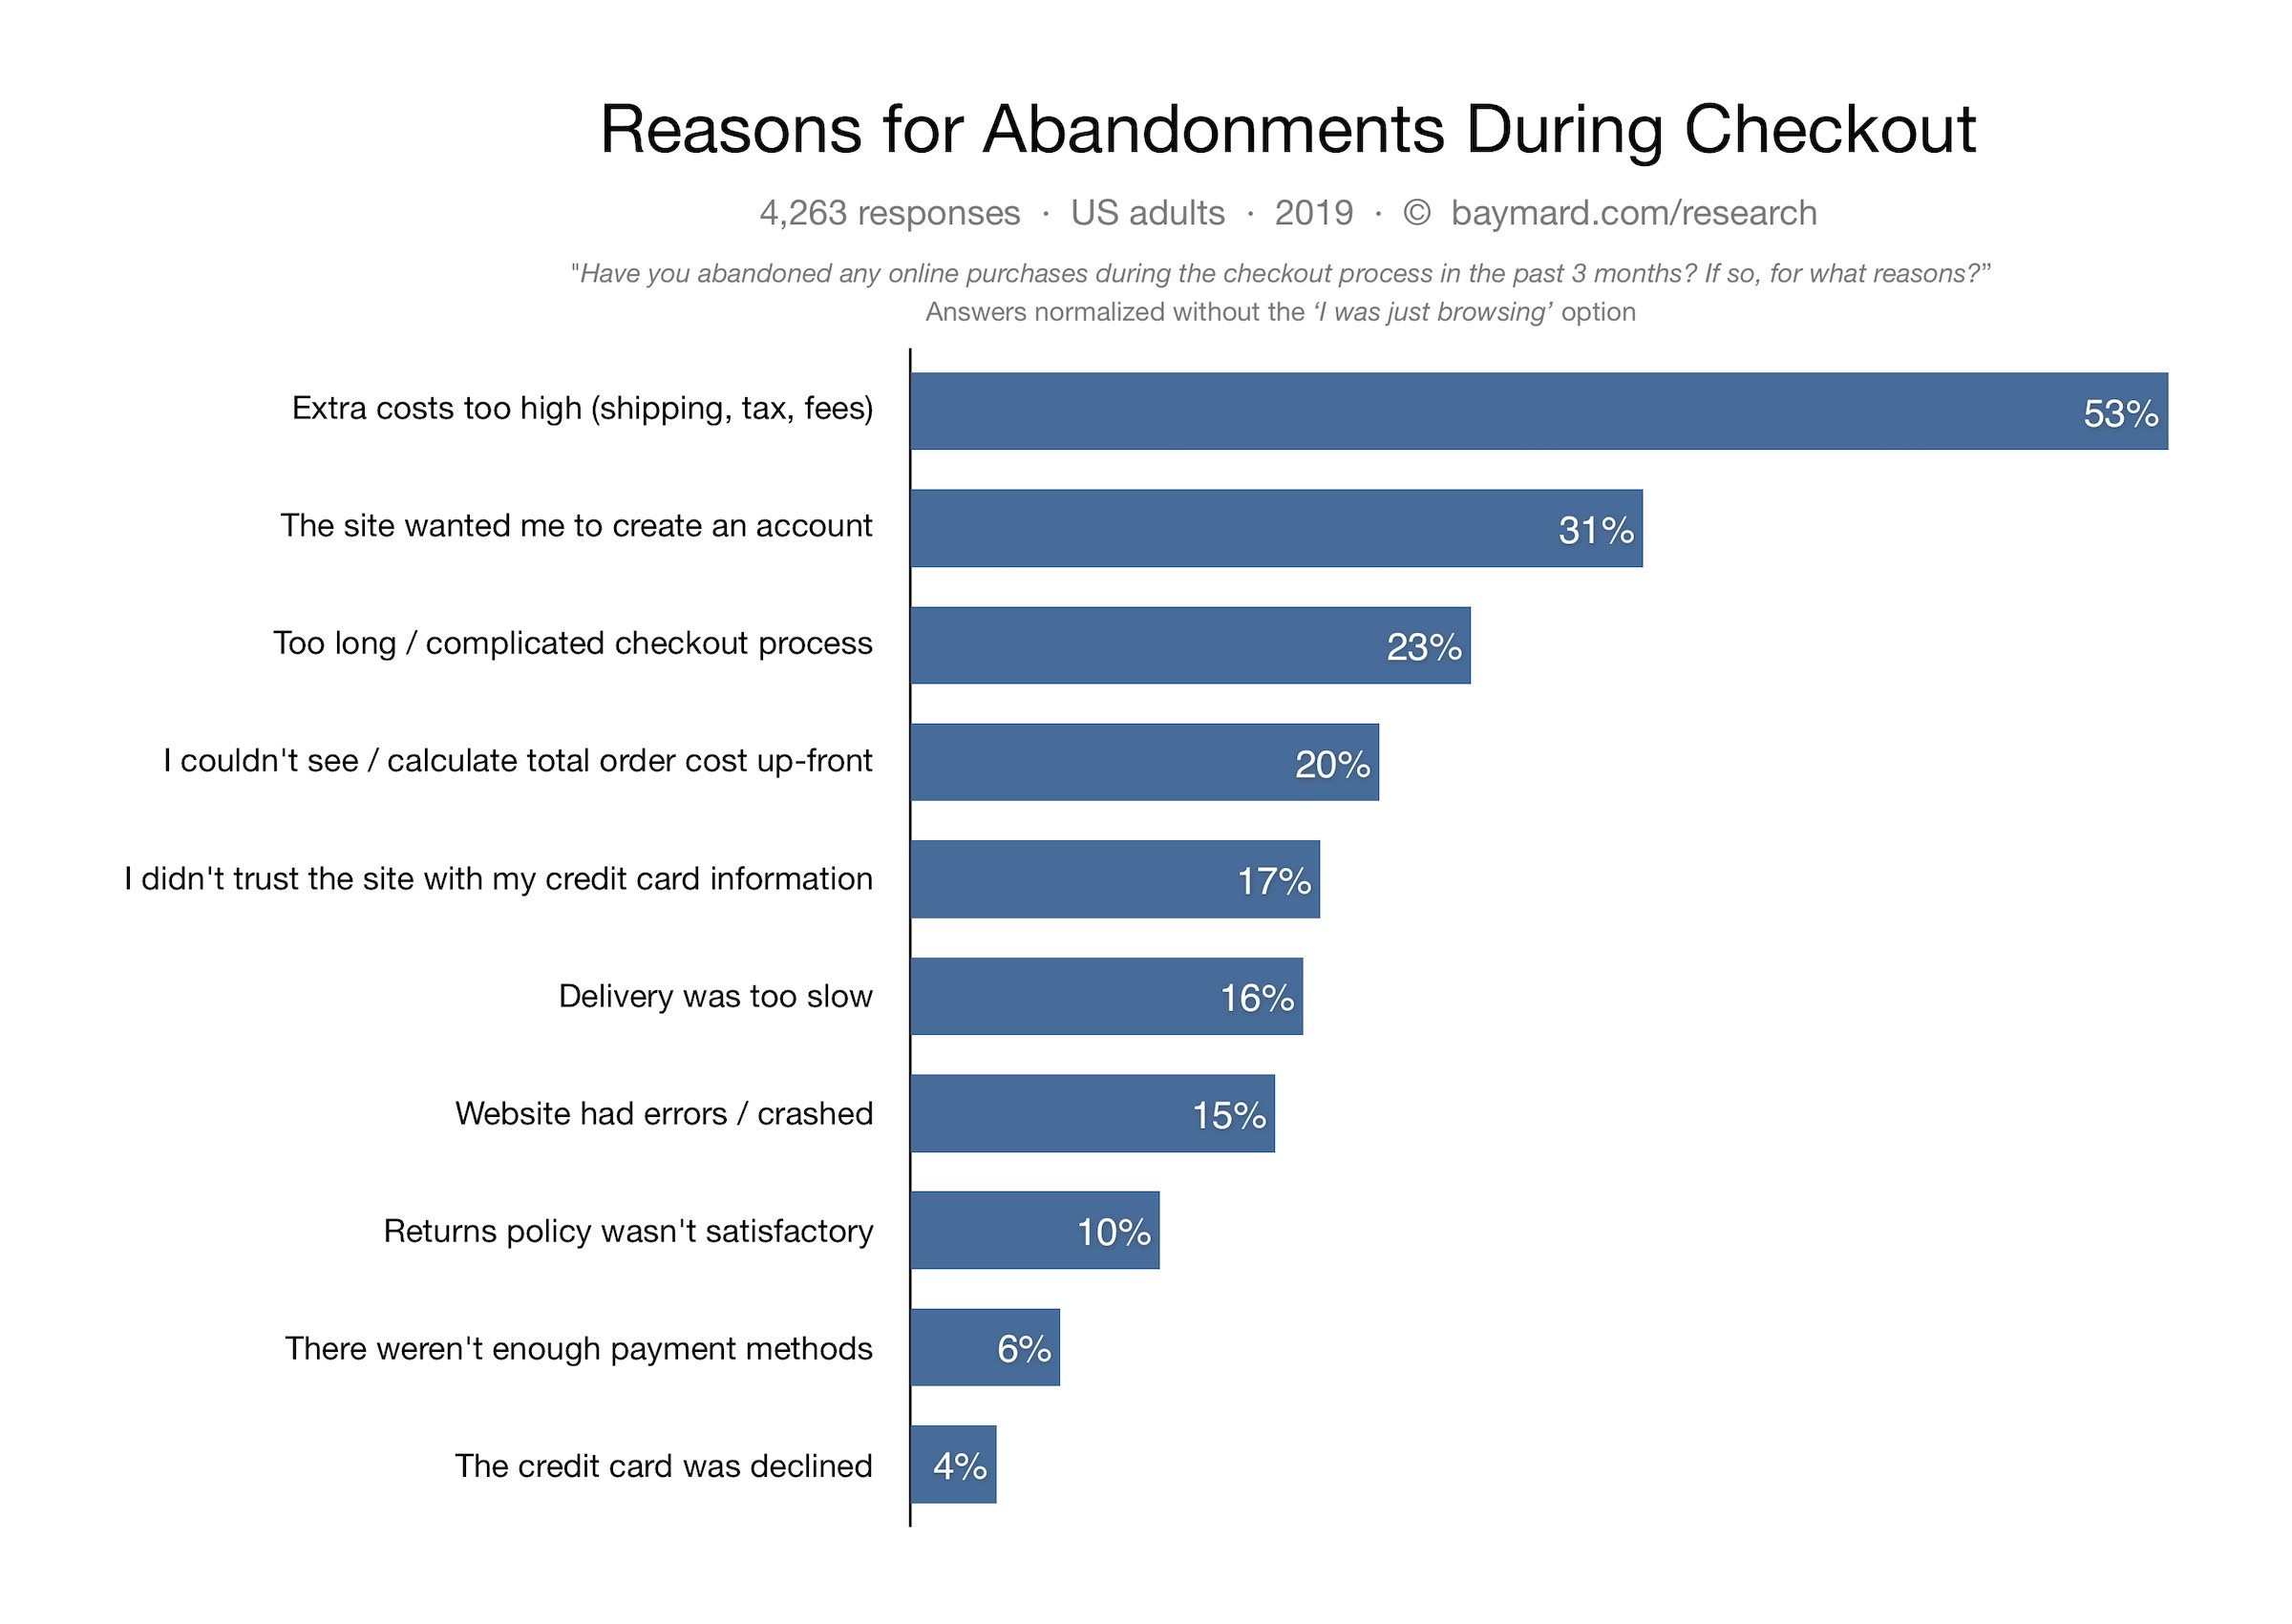
Cart Abandonment Statistics:

- About 53% of online shoppers leave their cart because of extra taxes and shipping costs that are too high. (Baymard Institute)
- Based on several e-commerce studies, the average cart abandonment rate in e-commerce is around 69.89%
- Due to the nearly 70% avg. cart abandonment rate and e-commerce sites are losing $3 billion dollars every year.
- Abandoned cart emails have a 45% of open rate (the percentage rate at which marketing emails are opened).
- A website with slow-loading pages increases the cart abandonment rate by 75%.
- Clothing items have the highest cart abandonment rate at 40%, followed by tech & electronics at 18% and home goods at 16%.
- Mobile devices have the highest cart abandonment of 78%, while Tablets have 70% and desktops/laptops have 67%.
E-commerce Consumer Behaviour Statistics: What Online Shoppers Really Care About!
The following are some of the most interesting revelations we’ve had when it comes to what online shoppers care about and how they react to a brand’s marketing & other tactics.
1. General Consumer Behaviour Ecommerce Statistics:
- Around 88% of customers begin their product searches online.
- 52% of customers agree that they started shopping online more since the pandemic.
- Surprisingly, 51% of shoppers take eco-friendliness and sustainability into consideration while making an online purchase.
- About 43% of online buyers make purchases while in bed, 23% at the office, and a combined 20% in a bathroom or car.
- 67% of millennials and 56% of the new generation (Gen Xers) prefer shopping online instead of in brick-and-mortar stores.
- Millennials and Gen Xers spend 50% more time on online shopping websites than older people.
- About 55% of online customers tell their family and friends if they are not happy with a product or brand.
- When shopping online, 81% of people trust the advice of their friends or family member.
2. Drunk Shopping Statistics
Interestingly, alcohol drinking is also responsible for boosting the revenue of many e-commerce stores. Here are some uncalled-for revelations about shopping under the influence of alcohol.
- Finder conducted a drunk shopping survey for Americans back in September 2020, where 21.4% of Americans confessed to shopping under the influence.
- Drunk shopping was at its peak in 2020 with an average drunk shopper spending $768.58 under the influence for online purchases.
- Though this number dropped to $423.73 for 2021.
- 79% of people who drink alcohol have made at least one drunk purchase.
- Men are twice as likely to buy something in non-sober conditions (while intoxicated) than women.
3. Men vs Women Online Shopping Statistics:
- As per studies, Men actually spend more time shopping online than women but they make fewer purchases.
- On average, Women make an online purchase 7 times a year compared to men who buy something online 5 times a year.
- Even though, men make online purchases less frequently, they spend more compared to women.
- Men spend on average $220 per transaction while women spend only $151 per transaction.
- Female shoppers tend to make purchase decisions 7% faster than men. That’s why online retailers target women more through social media ads.
4. Online Shoppers’ Expectations: Privacy & Special Treatments

- About 66% of customers who shop online prefer brands that are transparent with product ingredients and sources of their materials.
- 60% of online shoppers stop buying from brands due to poor customer experience.
- Back in 2018, 25% of customers used AI Chat to interact with a brand. This is increasing to a point where 90% of brands will deploy AI tech. next three years.
- 52% of online customers are attracted to businesses that share their values, culture, and how they treat working associates.
- When it comes to online sales and marketing questions, 82% of customers expect an immediate response from brands.
- 57% of online shoppers have concerns when brands ask for their personal information and how they use it.
- 44% of online shoppers don’t care if their favorite brands use their personal data to send updates and new offers.
- About 70% of customers appreciate a personalized experience if brands are using details that they willingly share.
- A regular online shopper has 3 times more chances of avoiding brands that over-personalize marketing compared to the ones that don’t personalize at all.
From the above-mentioned consumer behavior stats, we can deduce the following points for online shoppers’ expectations for personalized recommendation and their personal data.
- Online shoppers want brands to respect their data privacy while still wanting a personalized experience.
- They are not closing on brands that ask for personal data but they simply want businesses to know who’s going to use it and why.
- Shoppers are okay if their favorite brands use personal data to offer a better experience.
- Online shoppers avoid brands that over-personalize marketing to an extremely personal level.
- It increases their concerns to a point that they’d rather buy from a website offering zero personalized ads.
5 Interesting Shopify Statistics
Surely, e-commerce giants like Amazon and Walmart are people’s favorite choices, Shopify is one of the best e-commerce building platforms to run your own online store at your fingertips.
- At the moment (in June 2022), Shopify has a market capitalization of $40.19 Billion, making it the 389th most valuable company in the world by market cap.
- In February 2022, Littledata surveyed 2,597 Shopify stores and found that they generate $89 average e-commerce revenue per customer.
- An average revenue per customer of over 190 USD would make you the best 20% of Shopify stores, while anything more than 315 USD would put you in the top 10%.
- There are over 3,762,214 live Shopify websites in the world and over 2666 stores in the US, a growth of 178.53 percent from 2020.
- Shopify’s annual revenue in 2019 was $1.578 billion. This increased to $2.92 billion in 2020, showing 85.63% of growth from 2019. In 2021, the revenue was $4.612 billion, a 57.43% growth from 2022.
What Makes Shopify Unique & Successful?
Shopify’s popularity comes down to the fact that it is easy to use for anyone who has an internet connection. It is by far the most beginner-friendly platform to start an e-commerce business, especially for drop shipping.
- Shopify’s amazing user experience, products, and branding encourage teenagers to open an online store just for fun.
- Competing platforms like Shopware, Magneto, and BigCommerce are also very famous but due to their specific niche product categories make Shopify many people’s go-to option.
- Since WooCommerce runs just a few hundred thousand fewer online stores than Shopify, it is a good alternative. However, it is an open-source platform preferred by developers who use WordPress to customize the store as per their liking.
Frequently Asked Questions
1. How many people shop online in 2022?
Currently in 2022, there are over 2.5 billion people worldwide who shop online.
2. What Do People Buy the Most Online?
Fashion items remain at the top when it comes to online purchases, followed by tech and electronic items.
3. Who are the top online retailers in 2022?
Amazon.com remains the biggest e-commerce giant with a revenue of $121 billion in Q1 of 2022. It is followed by eBay, BBC shop us, Etsy, Walmart, and Best Buy.
4. Which country generates the most sales through social media?
China holds the top spot for social media sales with over $350 billion in revenue. For estimation, it is q0 times more than the US.
5. What percent of online retailers now have mobile commerce websites?
In 2022 there are over 85% of online retailers that have e-commerce websites.
Overall, You Should Remember the Following Things:
While eCommerce shoppers do prioritize price and convenience, that isn’t the only thing that online retailers have to worry about. There are so many trends that eCommerce stores/businesses have to catch up to. If you run an eCommerce business, you’ll have to keep track of marketing trends, efficiently use social media and understand what customers actually want. It’s difficult to stay on track with everything.
All the eCommerce statistics that we mentioned above point out the following facts.
- E-commerce brands are investing more and more in marketing every year.
- After pricing & convenience, being transparent with customers helps you win their trust and turn buying decisions in your favor.
- Social media platforms are integrating with e-commerce, allowing brands to sell products directly.
- Soon we’ll be treating Facebook Marketplace, Instagram & Pinterest shops like eCommerce platforms.
- Social media presence is vital for your brand’s success due to increasing users and social marketing trends.
References:
- https://kinsta.com/blog/ecommerce-statistics/
- https://companiesmarketcap.com/shopify/marketcap
- https://www.tidio.com/blog/online-shopping-statistics/
- https://www.statista.com/topics/871/online-shopping/#topicHeader__wrapper
- https://www.statista.com/statistics/750858/us-consumers-preferences-brand-contact/
- https://wpforms.com/ecommerce-statistics/
- https://99firms.com/blog/ecommerce-statistics/#gref
- https://ecommerceguide.com/ecommerce-statistics
- https://www.oberlo.in/blog/ecommerce-statistics
- https://www.drip.com/blog/e-commerce-statistics
- https://www.shopify.in/enterprise/global-ecommerce-statistics